

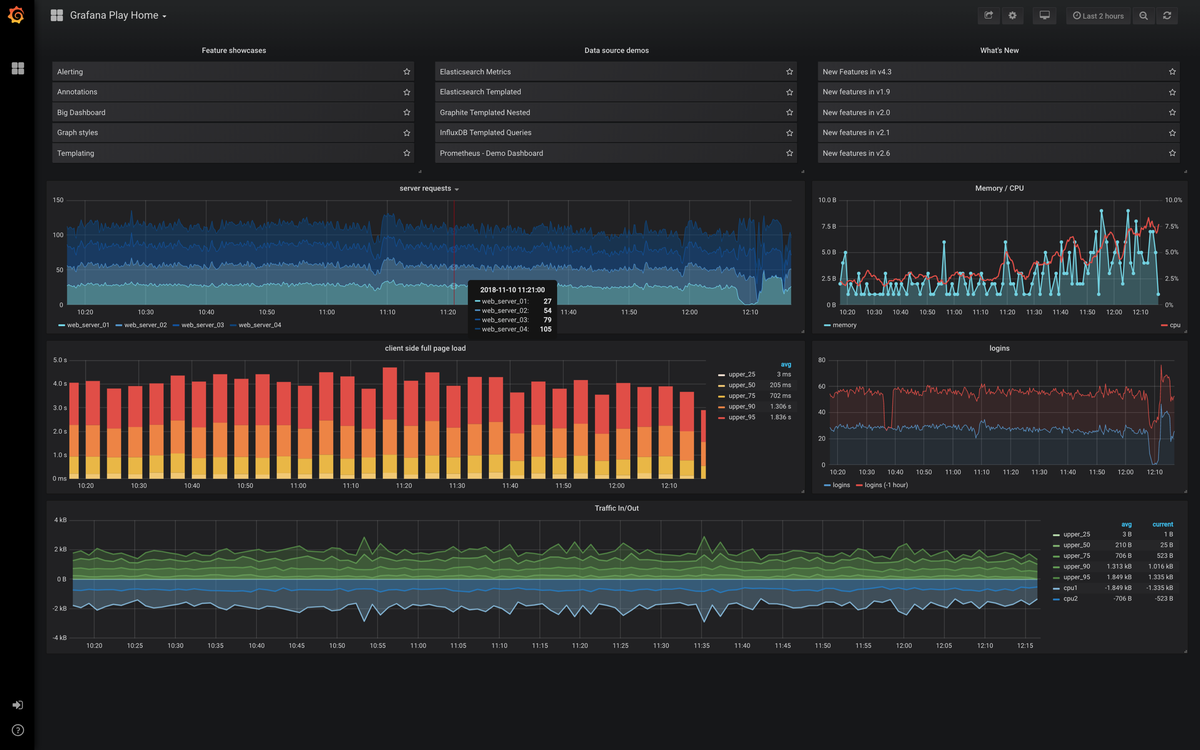
Run one shared Grafana and Prometheus stack for your whole home lab, not one per repo. I’ve got around 30 GitHub repos and 15-20 always-on self-hosted services, running mostly on one desktop plus a NAS (split by the placement framework from an earlier post).
Recently I found two separate Grafana containers sitting on that same desktop, each spun up by a different project’s docker-compose file, each with its own dashboards, and each blissfully unaware the other one existed. It’s the anti-pattern this post argues against. It happened because “just add a Grafana container to the compose file” felt like the path of least resistance at the time.
The isolation argument doesn’t apply to a personal setup#
Per-repo or per-tenant observability stacks solve exactly one problem: hard isolation between parties who must never see each other’s data. Grafana Labs’ own guidance treats a single shared stack as the default, reserving multi-tenant splits for cases like separate customers or separate teams inside a company, where combining dashboards would be a compliance or trust violation.
None of that applies here. Every service on the network is mine. There’s no tenant boundary to protect, and no isolation benefit worth buying with extra containers.
Does splitting the stack save memory?#
Fragmenting into two or three separate stacks wastes memory instead of saving it. Most of that footprint is fixed cost: the databases, the web UI, the query engine. None of it scales down with fewer targets. Multiply that fixed cost across five projects instead of paying it once, and it’s pure waste.
On my desktop, the two duplicate Grafana instances were doing exactly that: quietly holding memory a single shared one would never have needed twice.
Hub-and-spoke is the actual pattern people run at this scale#
Homelab operators running desktop-plus-NAS setups converge on the same shape: one central Prometheus/Grafana/Loki stack, plus a lightweight collection agent on every monitored host. The current standard agent is Grafana Alloy, an OpenTelemetry-based collector that replaced the older Grafana Agent (now deprecated and past end-of-life).
Alloy ships metrics, logs, and traces from each host back to the one shared backend, using a single config file per host: one small agent per machine instead of one full stack per project. That’s the part I got backwards, letting each project’s compose file drag its own Grafana along for the ride.
Keeping the central stack on a separate machine from the workloads it watches matters too.
Split stack and workload physically, not just logically, and “monitoring” becomes something you can trust mid-incident.
The migration: anti-pattern on the left, target on the right.
flowchart TD
    subgraph Before["Before: one stack per repo"]
        A1[Repo A] --> G1[Grafana + Prometheus A]
        A2[Repo B] --> G2[Grafana + Prometheus B]
        A3[Repo C] --> G3[Grafana + Prometheus C]
    end
    subgraph After["After: hub-and-spoke"]
        H[One central Prometheus/Grafana/Loki stack]
        S1[Alloy agent, host 1] --> H
        S2[Alloy agent, host 2] --> H
        S3[Alloy agent, host 3] --> H
    end
This is the same shared-infrastructure pattern I already use#
I already draw a line between shared infrastructure and project-specific code. Networking and VPN routing live in one dedicated infra repo, and shared libraries get imported by whichever project needs them instead of copy-pasted into each one.
Observability belongs in the same category: plumbing every project needs, something no single project owns. Treating it as project-specific, letting each repo bootstrap its own copy, is the same mistake as vendoring a shared library into five places and letting the copies drift.
The real downside: cross-project noise and a bigger blast radius#
The honest cost of consolidating: one shared stack means one shared failure domain and one shared signal-to-noise problem.
- A misbehaving data-ingestion service can spam the same Grafana instance that’s supposed to be giving a calm read on a media pipeline’s health. Without rigorous tagging and labeling, alerts from unrelated projects blur together.
- A stack outage now takes down visibility into everything at once, instead of just one project.
- Dashboard sprawl is the risk I’ll actually admit to: once ten or fifteen projects report into the same Grafana instance, the dashboard list turns into its own mess without folders and consistent naming.
The fix is discipline: admit the problem exists instead of giving up and splitting the stacks anyway:
- Consistent labels
- Per-project dashboard folders
- Alert routing that filters by service
What I’m doing about it#
I’m standing up a single Prometheus, Grafana, and Loki stack in my shared infrastructure repo, with Alloy as the collector on every host instead of the deprecated Agent.
- Each service exposes a metrics endpoint where it has one.
- Node- and container-level metrics get scraped centrally instead of per-project.
- The two duplicate Grafana instances get their dashboards migrated over, then decommissioned one at a time, carefully, since one of those projects touches live financial data and I’d rather not break its alerting mid-migration.
- Services with zero monitoring today get wired into the shared stack as I go, instead of getting their own bespoke setup.
None of this needed new hardware or a new product. Just admitting that “quick, add Grafana to this compose file” was a decision I kept making locally, one compose file at a time, that never added up to a coherent system. Observability isn’t part of each project. It’s part of the network.